Dashboard
Monitor your assistant's performance with real-time metrics and conversation history.
Dashboard
The Dashboard is your assistant's control panel. At a glance, you know exactly what's happening: how many conversations took place, how many the assistant resolved on its own, and whether anyone on your team is handling a conversation right now.
What counts as a conversation in TAU
Before looking at the numbers, it's important to understand what TAU considers a conversation — because it's different from what most competitors do, and that makes a real difference to your bottom line.
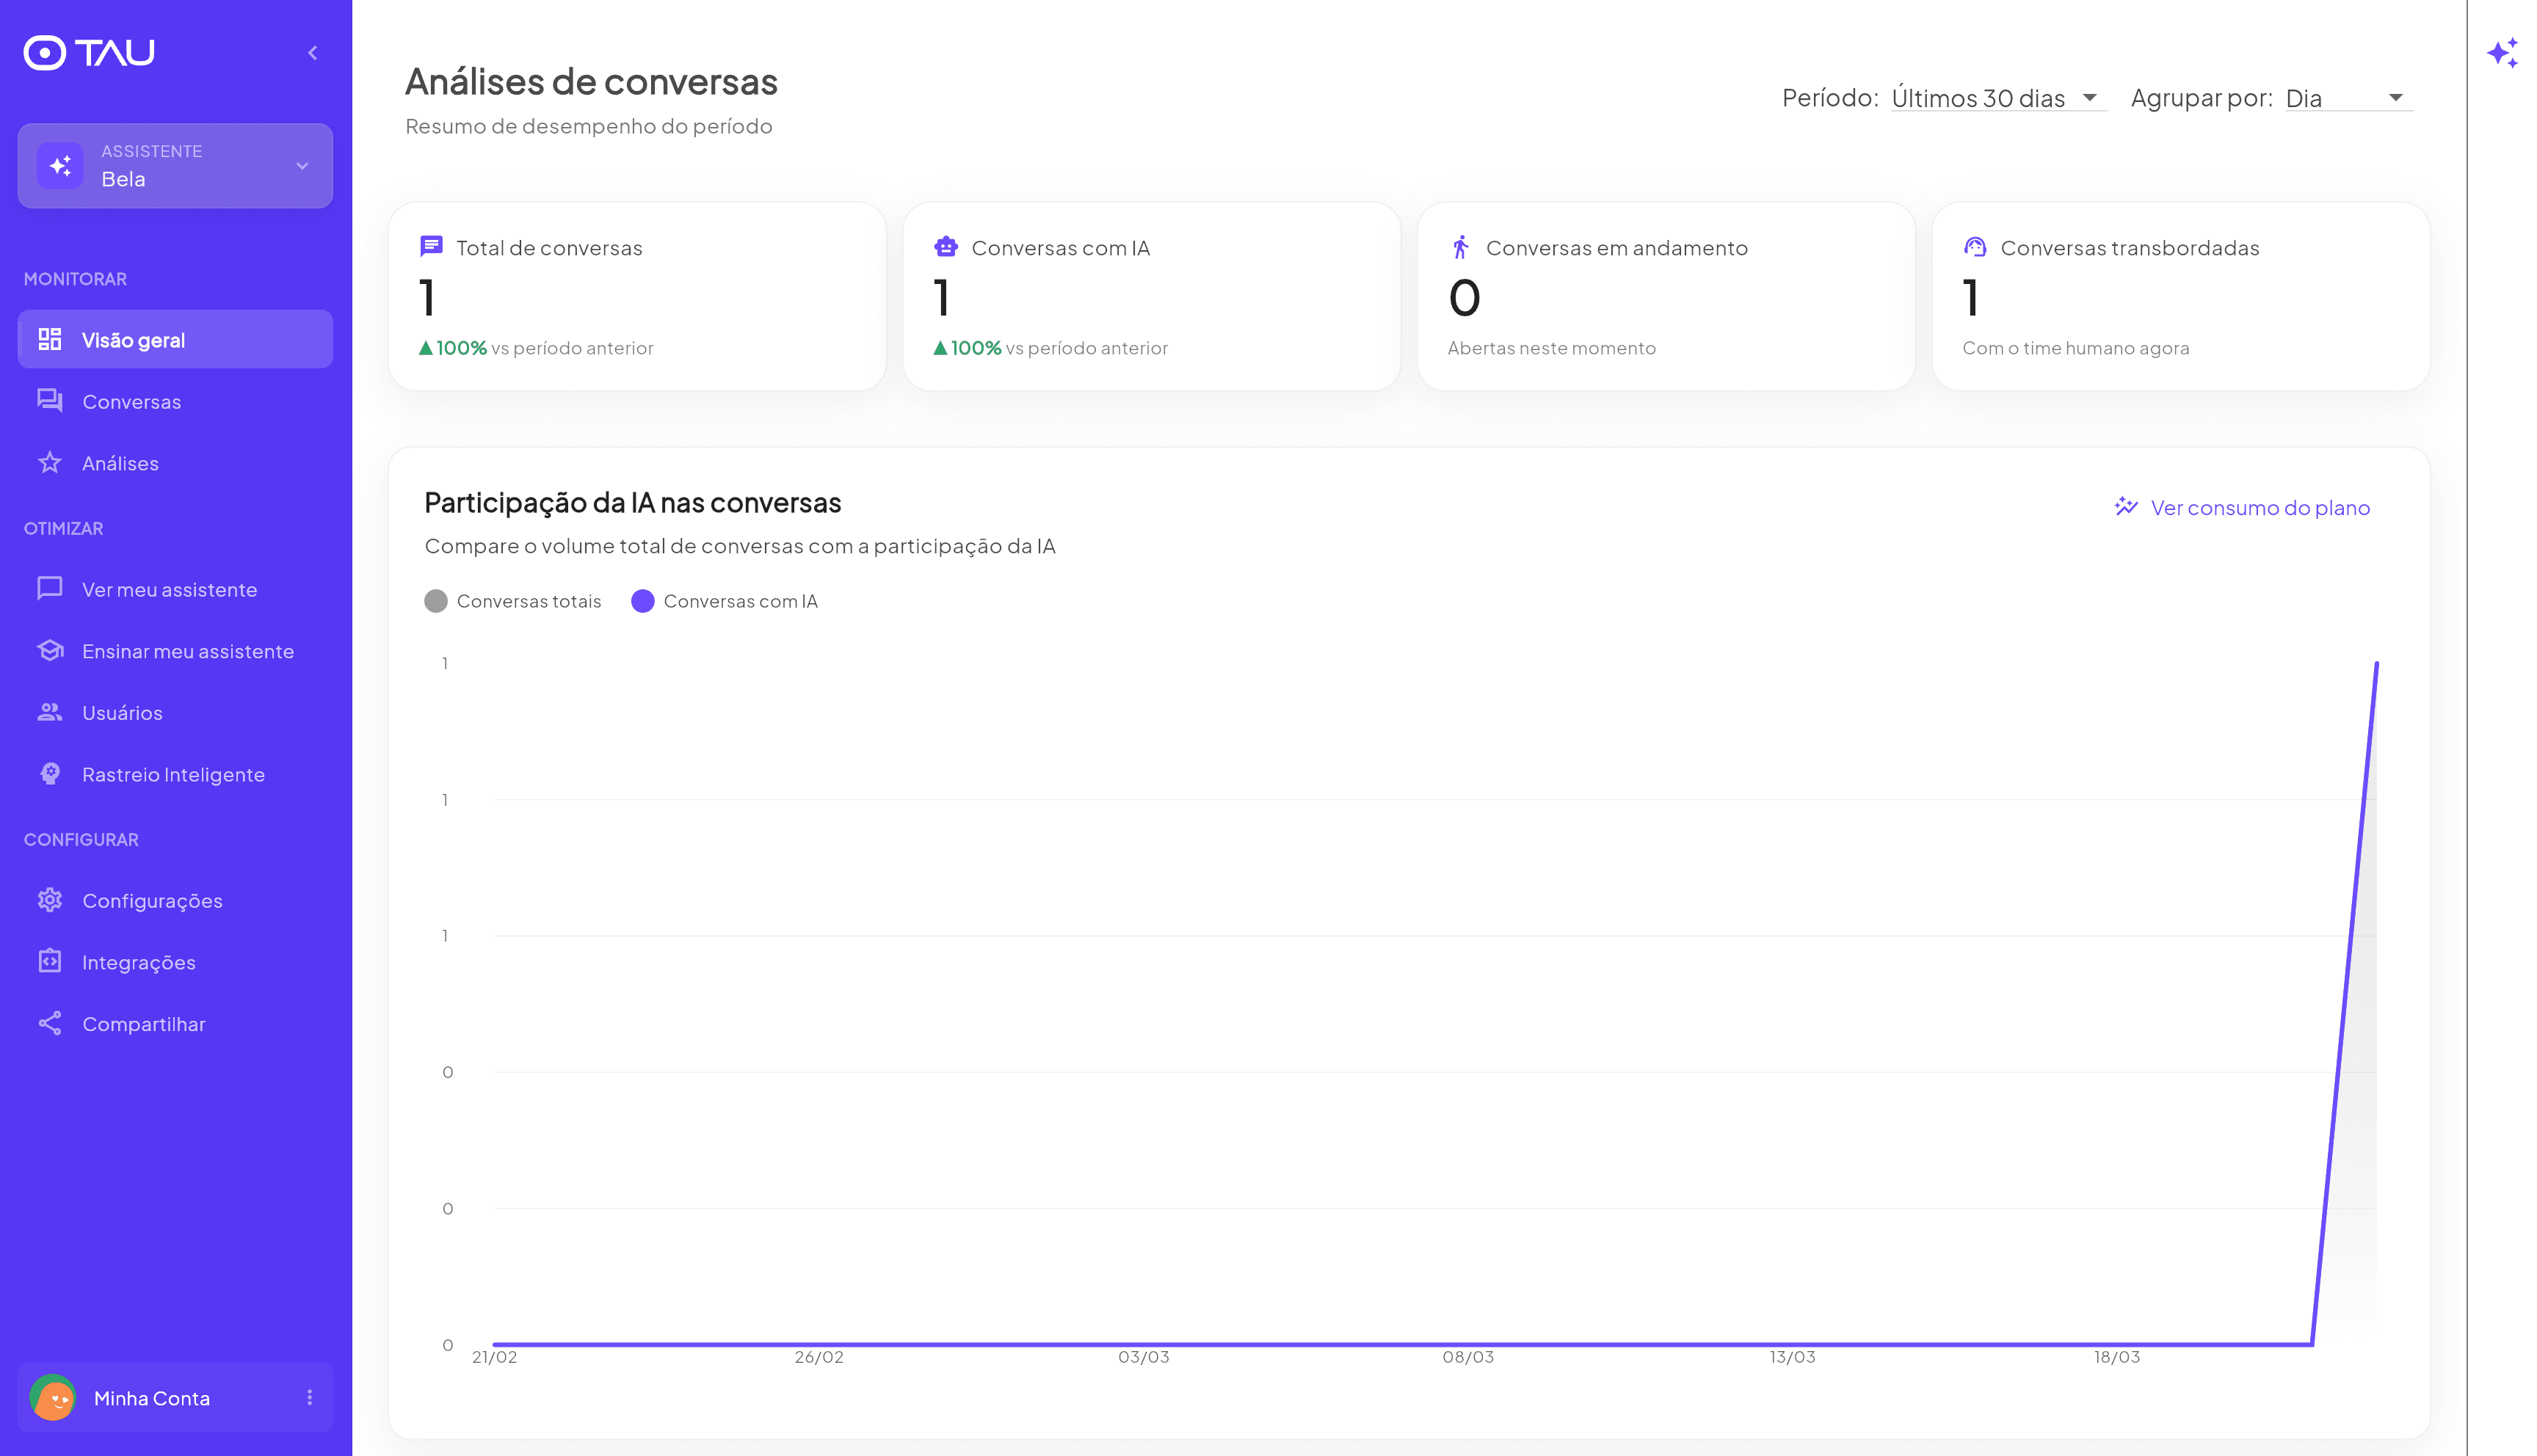
Period metrics
Four cards at the top summarize performance for the selected period:
| Metric | What it means |
|---|---|
| Total conversations | All conversations started in the period |
| AI conversations | How many were answered by the assistant |
| Ongoing conversations | Open right now (real time) |
| Handed-off conversations | Passed to a human right now |
Each card also shows the change compared to the previous period — a green arrow indicates growth, red indicates a decline.
The ratio between Total conversations and AI conversations shows how much of your service is already being automated. The closer these numbers are, the less time your team is spending answering repetitive questions.
Filters
Period
Analyze performance over any time window:
- Today / This week / This month / This year
- Last 7 days / Last 30 days
- Current cycle / Previous cycle — based on your billing cycle
- Last year
- Custom... — choose any date range
Grouping
Controls how data is grouped in the chart:
- Day — one point per day (default)
- Other groupings available depending on the selected period
Chart — AI participation in conversations
The line chart compares over time:
- 🔘 Total conversations — total volume of service interactions
- 🟣 AI conversations — how much of that volume the assistant resolved
When the two lines run close together, your assistant is covering nearly everything. When there's a gap between them, it means some conversations are being resolved by humans — that may be a signal to add more content to the Knowledge Base.
Recent conversations
Below the chart, the dashboard lists the most recent conversations separated by status:
- Ongoing — conversations currently open
- Handed off — waiting for human service
- Closed — recently ended conversations
Click any conversation to open the full history on the Conversations screen.
Plan usage
Click View plan usage to track how many conversations have been used in the current cycle. The chart shows daily usage since the start of the cycle.
The number shown here is what will be charged on your plan — only conversations where the AI assistant participated. Conversations handled manually by your team are not counted here. The total conversations in the main dashboard may be higher.
The free plan includes 30 conversations per month. The counter resets each billing cycle.
Mia Impact
For operations with connected bookings, TAU can also show the Mia Impact screen. It displays booked revenue, Mia's share of the schedule, services outside business hours, and opportunities highlighted by Leo.
Use this screen when you want to prove the assistant's commercial value, not just monitor conversation volume.